Archive for andrew

Using Syslog with MySQL Cluster

By default, MySQL Cluster sends log data to a file but you can also send it to the console or to Syslog; this article explains how to send it to Syslog. The example given here is for LINUX.

In this example, I’ll use the “user” syslog facility name and so the first step is to make sure that syslog is configured to route those messages. If this hasn’t already been configured then add the following lines to /etc/rsyslog.conf:

# Log user messages to local files
user.*    /var/log/user

For the changes to take effect, restart the syslog service:

[root@ws1 etc]# service rsyslog restart
Shutting down system logger:                               [  OK  ]
Starting system logger:                                    [  OK  ]

Note that you should make those changes as root.

Still as root, start up a stream of  any additions to the new log file:

[root@ws1 etc]# tail -f /var/log/user

To tell Cluster to use Syslog, add this line into the [ndb_mgmd] section in config.ini:

LogDestination=SYSLOG:facility=user

and then start up your Cluster as normal.

You should now be able to see that MySQL Cluster information is being logged to /var/log/user.

You can adjust how much information is logged either through the config file or from the ndb_mgm tool, for example – to see when global checkpoints are written:

ndb_mgm> all clusterlog checkpoint=15
Executing CLUSTERLOG CHECKPOINT=15 on node 3 OK!
Executing CLUSTERLOG CHECKPOINT=15 on node 4 OK!
Note that a log-level of 15 will show all logs and 0 will show none. Other log categories besides CHECKPOINT are STARTUP, SHUTDOWN, STATISTICS, NODERESTART, CONNECTION, INFO, ERROR, CONGESTION, DEBUG and BACKUP.


MySQL Cluster presentation at Oracle Open World 2010

As part of “MySQL Sunday” at this year’s Oracle Open World, Mat Keep and I will be presenting on the latest MySQL Cluster features. We’ll be presenting at 15:30 (Pacific Time) on 19th September (the event starts with a key note at 12:30).

If you’re attending Oracle Open World then please indicate that you’d like to attend the MySQL Sunday when you register. If you aren’t planning to go to Oracle Open World but will be in the San Francisco area then buying a Discover pass (only $50 if you register by 16 July) will get you into the MySQL Sunday sessions. Register here.

For details on the presentations and speakers, check here.


Webinar today – Scaling Web Services with MySQL Cluster, Part 1: An Alternative to MySQL Server & memcached

The replay of this webinar is now available from http://www.mysql.com/news-and-events/on-demand-webinars/display-od-545.html

MySQL and memcached has become, and will remain, the foundation for many dynamic web services with proven deployments in some of the largest and most prolific names on the web. There are classes of web services however that are update-intensive, demanding real-time responsiveness and continuous availability. In these cases, MySQL Cluster provides the familiarity and ease-of-use of the regular MySQL Server, while delivering significantly higher levels of write performance with less complexity, lower latency and 99.999% availability. This webinar will discuss the use-cases for both approaches, and provide an insight into how MySQL Cluster is enabling users to scale their update-intensive web services.

The webinar starts at 09:00 Pacific/17:00 UK/18:00 CET today (June 9th 2010).

Still time to register (for free) at http://www.mysql.com/news-and-events/web-seminars/display-545.html – even if you can’t attend, this way you’ll get sent a link to the charts and replay.

EAVB_ZZDDGVLWJR


Download, install, configure, run and test MySQL Cluster in under 15 minutes

Single host Cluster

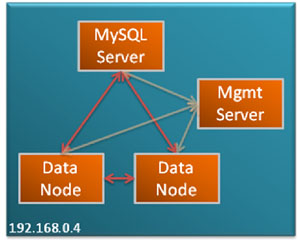
A series of quick-start guides are now available to get you up and running with MySQL Cluster in as little time as possible; they are available for LINUX/Mac OS X, Windows and Solaris. The configuration is intentionally a simple one – 2 data nodes, 1 management node and 1 MySQL Server. Once you have this up and running, your next experiment may be to extend this over multiple hosts.

Download the Quick Start Guide for your platform below:

These links are also available from the MySQL Cluster download page.

The intent is that these guides should be simple to follow even if you have never tried MySQL Cluster (or even MySQL) before. Any comments or suggested improvements would be appreciated.


MySQL Cluster 7.1.4b binaries released

The binary version for MySQL Cluster 7.1.4b has now been made available at http://www.mysql.com/downloads/cluster/

A description of all of the changes (fixes) that have gone into MySQL Cluster 7.1.4b (compared to 7.1.3) can be found in the MySQL Cluster 7.1.4b Change Log.


Breakfast seminar on what’s new with MySQL – London

If you’re in London on Thursday 24th June then there’s a great chance to find out what’s new in MySQL.

Join us for an Oracle MySQL Breakfast Seminar to better understand Oracle’s MySQL strategy and what’s new with MySQL!
Agenda:
09:00 a.m.    Welcome Coffee/Tea
09:30 a.m.    Oracle’s MySQL Strategy
10:00 a.m.    What’s New – The MySQL Server & MySQL Cluster
10.45 a.m.    Coffee/Tea Break
11:00 a.m.    What’s New – MySQL Enterprise & MySQL Workbench
11:45 a.m.    Q&A
12:00 noon    End of the Breakfast Seminar

Cost?
None, it’s a free event! But places are limited and the seminar is held on a first come first served basis, so register quickly!

Location:

Sun Microsystem’s Customer Briefing Center
Regis House
45 King William Street
London EC4R 9AN
Tel: (020) 7628 3000

Image courtesy of Anirudh Koul.

Join us for an Oracle MySQL Breakfast Seminar in London, Thursday June 24th 2010, to better understand Oracle’s MySQL strategy and what’s new with MySQL!

Agenda:
09:00 a.m. Welcome Coffee/Tea
09:30 a.m. Oracle’s MySQL Strategy
10:00 a.m. What’s New – The MySQL Server & MySQL Cluster
10.45 a.m. Coffee/Tea Break
11:00 a.m. What’s New – MySQL Enterprise & MyQL Workbench
11:45 a.m. Q&A
12:00 noon End of the Breakfast Seminar

* Agenda subject to change

Cost?
None, it’s a free event! But places are limited and the seminar is held on a first come first served basis, so register quickly!


MySQL Cluster Scores with Pyro and Cell C at the FIFA World Cup – new case study

The Pyro Group has selected the MySQL Cluster database to power their InRoam SDP (Service Delivery Platform). InRoam enables Cell C and their network partners to provide low cost, border-less mobile communications services to hundreds of thousands of football fans from around the world as they descend on South Africa for the 2010 FIFA World Cup tournament.

This new case study can be downloaded from http://www.mysql.com/why-mysql/case-studies/mysql_cs-pyro_telecoms.php

Solution Overview

  • Pyro InRoam SDP is an intelligent application enabling subscribers to communicate with ease across borders
  • Migrated from a Microsoft platform with SQL Server to offer greater choice and less restrictive licensing
  • MySQL Cluster selected to power the SDP as a result of high transactional throughput, low latency, carrier-grade availability and low cost
  • MySQL Cluster database supports 7 million roaming subscribers per day, performing 1,000 reads or 500 writes per second on up to 1TB of data accessed over SQL and the native NDB C++ API
MySQL Cluster Scores with Pyro and Cell C at the FIFA World Cup


Scaling Web Services with MySQL Cluster: An Alternative Approach to MySQL & memcached

A new white paper is available from http://www.mysql.com/why-mysql/white-papers/mysql_wp_cluster_ScalingWebServices.php

MySQL and memcached has become, and will remain, the foundation for many dynamic web services with proven deployments in some of the largest and most prolific names on the web.

There are classes of web services however that are highly transactional and update-intensive, demanding real-time responsiveness and continuous availability. In these cases, MySQL Cluster provides the familiarity and ease-of-use of the regular MySQL Server, while delivering significantly higher levels of write performance with less complexity, lower latency and 99.999% availability.

This whitepaper will discuss the use-cases for both approaches, and provides an insight into how MySQL Cluster is enabling users to scale update-intensive web services.

Scaling Web Services with MySQL Cluster: An Alternative Approach to MySQL & memcached


MySQL Cluster Powers Leading Document Management Web Service

A new customer case-study is available for download from http://www.mysql.com/why-mysql/case-studies/mysql_cs-cluster_docudesk_WebServices.php

The DocQ web service eliminates the limitations of sharing physical documents by offering a complete paperless business solution; providing a single place where customers can manage, archive, and send their important documents. DocQ supports secure business transactions and the services to store, edit, collaborate, and publish business documents.

  • The database needed to deliver the high levels of write throughput, low latency responsiveness and continuous availability demanded by the service
  • A sharded, multi-master MySQL solution with memcached was rejected due to the complexity of integration and management
  • MySQL Cluster was selected as it met all of the requirements of the service with one, integrated solution out of the box
  • MySQL Cluster is handling on average 1 million queries per day across both in-memory and disk-based tables, with the database growing at up to 2% daily
  • MySQL Cluster handles document metadata and text, PHP session state, ACLs, job queues and tracking of document actions for billing


Configure MySQL Enterprise Monitor to monitor MySQL Cluster

MySQL Cluster 7.1 introduced the ndbinfo database which contains views giving real-time access to a whole host of information that helps you monitor and tune your MySQL Cluster deployment. Because this data can be accessed through regular SQL, various systems can be configured to monitor the Cluster. This post gives one example, extending MySQL Enterprise Monitor to keep an eye on the amount of free memory on the data nodes (through a graph) and then raise an alarm when it starts to run low – even generating SNMP traps if that’s what you need.

One of the features of MySQL Enterprise Monitor is that you can define custom data collectors and that those data collectors can run SQL queries to get the data. The information retrieved by those custom data collectors can then be used with rules that the user defines through the MySQL Enterprise Monitor GUI to create warning/alarms.

In this example, I create two new data collectors in the file”<MySQL Enterprise Monitor installation directory>/agent/share/mysql-proxy/items/cluster.xml” before starting up the MySQL Enterprise Monitor agent (note that these should be created for the agent of each MySQL Server in the Cluster that you would like to use to present the information from the data nodes):

cluster.xml:

<?xml version="1.0" encoding="utf-8"?>
<classes>
  <class>
    <namespace>mysql</namespace>
    <classname>cluster_max_used</classname>
    <query><![CDATA[SELECT MAX(used) AS Used FROM ndbinfo.memoryusage WHERE memory_type = 'Data Memory';]]></query>
  </class>
  <class>
    <namespace>mysql</namespace>
    <classname>cluster_min_avail</classname>
    <query><![CDATA[SELECT MIN(total) AS Total FROM ndbinfo.memoryusage WHERE memory_type = 'Data Memory';]]></query>
  </class>
</classes>

So that the agent picks up this file, it should be referenced within <MySQL Enterprise Monitor installation directory>/agent/mysql-monitor-agent.ini:

agent-item-files = share/mysql-monitor-agent/items/quan.lua,share/mysql-monitor-agent/items/items-mysql-monitor.xml,
share/mysql-monitor-agent/items/custom.xml,share/mysql-monitor-agent/items/cluster.xml
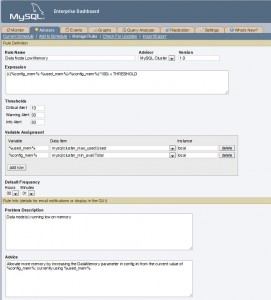
In MySQL Enterprise Monitor, events are raised by rules. Rules are grouped together into Advisors and so I create a new Advisor called “MySQL Cluster” and then create just one new rule within that Advisor group.

As shown in Fig. 1 the rule is called “Data Node Low Memory”. The “Variable Assignment” section is used to define 2 variables %used_mem% and %config_mem% which are populated from the Used and Total results from the 2 new data collectors. The “Expression” section is used to test “((Total Used)/Total)x100< THRESHOLD” and then the values to be substituted for THRESHOLD are defined in the “Thresholds” section – indicating at what points the Info, Warning and Critical Alters should be raised.

There are then a number of optional sections that you can use to add useful information to the person investigating the alert.

Once the rule has been created, the next step is to schedule and (if desired) tag that the alerts should also result in SNMP traps being raised. This is standard MySQL Enterprise Monitor practice and so it isn’t explained here except to point out that this rule is monitoring information from the data nodes but the rule has to be applied to a MySQL Server in the Cluster (MySQL Enterprise Monitor has no idea what a data node is) and so you need to schedule the rule against one or more arbitrary MySQL Server instances in the Cluster).
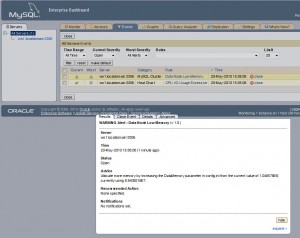
Fig. 2 Warning alert

To test the functionality, start adding more data to your MySQL Cluster until the Warning alert is triggered as shown in Fig. 2. As you can see, the optional information we included is shown – including values from Used and Total.
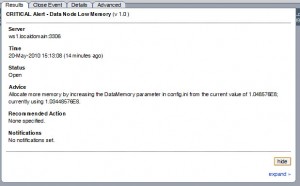


Fig. 3 Major alert

I then add more data to the database until the critical alert is raised and confirm that it’s displayed on the main monitoring panel of the MySQL Enterprise Monitor dashboard. Note that if you requested these alerts be included with the SNMP feed then SNMP traps will also be raised.

Please note that this example is intended to illustrate the mechanics of setting up monitoring on an arbitrary piece of data from ndbinfo and obviously in the real world you would want to monitor more than just the memory and even for the memory, you might want to use a more sophisticated rule.
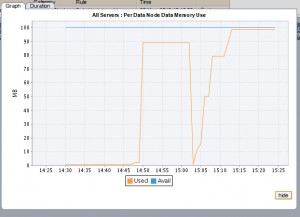
Fig. 4 Custom graph for memory usage


It is sometimes more useful to see how a value changes over time. For this, MySQL Enterprise Monitor provides graphs. The data collectors created for the rule can also be used to add a new graph to Enterprise monitor. The graph is defined by creating the following file:

<com_mysql_merlin_server_graph_Design>
  <version>1.0</version>
  <uuid>b0bc2bba-ea9b-102b-b396-94aca32b0b28</uuid>
  <tag></tag>
  <name>Per Data Node Data Memory Use</name>
  <rangeLabel>MB</rangeLabel> <frequency>00:01:00</frequency>
  <series>
    <label>Used</label>
    <expression>cluster_data_node_used_data_memory/1024/1024</expression>
  </series>
  <series>
    <label>Avail</label>
    <expression>cluster_data_node_config_data_memory/1024/1024</expression>
  </series>
  <variables>
    <name>cluster_data_node_used_data_memory</name>
    <dcItem>
      <nameSpace>mysql</nameSpace>
      <className>cluster_max_used</className>
      <attribName>Used</attribName>
    </dcItem>
    <instance>local</instance>
  </variables>
  <variables>
    <name>cluster_data_node_config_data_memory</name>
    <dcItem>
      <nameSpace>mysql</nameSpace>
      <className>cluster_min_avail</className>
      <attribName>Total</attribName>
    </dcItem>
    <instance>local</instance>
  </variables>
</com_mysql_merlin_server_graph_Design>
 

Fig. 5 MySQL Enterprise Monitor dashboard

Click on Import/Export in the Graphs tab in Enterprise Monitor (2.2) and then import the file defining the graph.

The graph will then appear on the graphs tab and can also be configured to appear on the main dashboard as shown in Fig. 5