MySQL Enterprise Monitor with MySQL Cluster
A few months ago, I posted a walkthrough of how to extend MySQL Enterprise Monitor in order to monitor MySQL Cluster. The great news is that as of MySQL Enterprise Monitor 2.3 (available from Oracle E-Delivery since 1st November) this functionality is included in the core product and so there is no need to add the extra features in manually. Of course, that post might still be of interest if you want to further extend MySQL Enterprise Monitor.
This post briefly steps through the new (Cluster-specific) functionality but if you’re interested, why not try it for yourself and download the new MySQL Enterprise Monitor software from Oracle E-Delivery. If you like what you see then the good news is that if you take out a subscription for MySQL Cluster CGE (or buy a license) then this now also entitles you to use MySQL Enterprise Monitor.
There are two main aspects that have been extended to cover MySQL Cluster:
- A new MySQL Cluster Advisor has been added. This Advisor is made up of a set of rules that check various aspects of the data nodes and raise alerts if a configurable threshold is exceeded
- A set of new graphs have been added so that you can monitor the usage of key resources over time.
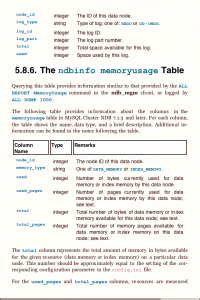
Note that MySQL Enterprise Monitor has no direct connection to the data nodes and so one or more of the MySQL Servers from the Cluster is effectively used as a proxy. There is nothing special for you to configure on the servers, behind the scenes, Enterprise Monitor is reading the contents of the ndbinfo database that was introduced in MySQL Cluster 7.1.
If using an older version of MySQL Cluster then you get less benefit from MySQL Enterprise Monitor but there is still some value in using it to monitor the MySQL Servers that are part of the cluster:
- Use the Query Analyzer to keep track of how your applications access the database and troubleshoot performance issues
- Monitor the state of the MySQL Server itself (number of client connections, CPU usage etc.)
- Generate alerts when data nodes are out of service.

Schedule Cluster Rules Against the Servers
There is documentation covering installing and running the MySQL Enterprise Monitor service manager and agents and so I won’t repeat the steps here except to point out that you need one or more of the agents to be configured to monitor one or more of the MySQL Servers in your Cluster. Of course, you could monitor multiple MySQL Cluster deployments from the same dashboard – just make sure that you have an agent monitoring at least one MySQL Server from each one.
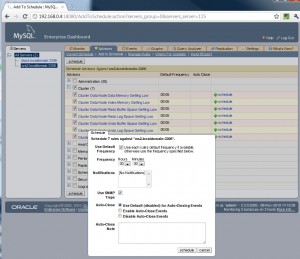
By default, none of the rules from the MySQL Cluster Advisor are scheduled against any of your servers and so the first thing you need to do is go to the “Advisors” tab and from their select “Add to Schedule”. Select the server(s) on the left and then check the radio button(s) against the whole Cluster advisor or against one or more of the rules within it and click the “schedule” button. You’ll then be given the option to override the default frequency that each rule is run before confirming the activation (scheduling) of the rule(s) for your server(s). This is also the point where you can indicate whether or not an SNMP Trap should be raised when the alert is raised/cleared (the destinations for the SNMP notifications can be set under the “Settings” tab).

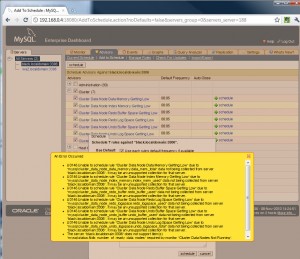
Error scheduling rules against wrong version of MySQL Server
Note that if you try scheduling the Cluster Advisor rules against a MySQL Server that is not part of a MySQL Cluster 7.1 (or later) deployment they you will get errors indicating that the server cannot provide the required data.

MySQL Cluster Graphs
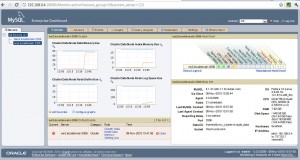
The new MySQL Cluster graphs are activated by default and you can view them from the “Graphs” tab but note that if there are no MySQL Cluster 7.1 servers in the list that you highlight on the left of the browser then the Cluster graphs will be hidden.

Customize Cluster Rule
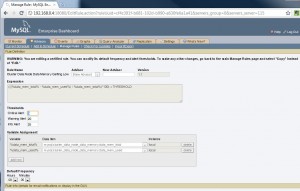
Note that there is still scope for simple customizations directly from the the MySQL Enterprise Monitor GUI. For example if you don’t think that the default thresholds are appropriate for your configuration then select “Manage Rules” within the “Advisors” tab and then click “edit” next to the rule in question – you then get the option to alter the threshold values.
As a final configuration step, go back to the “Monitor” tab and click on “edit favorites” to promote your favourite Cluster graphs to the home screen.

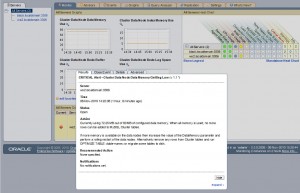
Details of Cluster alert
Any Critical alerts (including ones for the newly scheduled Cluster rules) will appear on the Monitor page – to see the Info and Warning alerts, select the “Events” tab. Clicking on any of these alerts will give you extra details and the opportunity to close the alert.
